Figure 1
For figure 1 the red line representing Step (Step is the name of the force plate representing the curb) indicated the foot placement prior to stepping down. The AP force applied appeared normal in relation to force patterns that have no interruptive step.
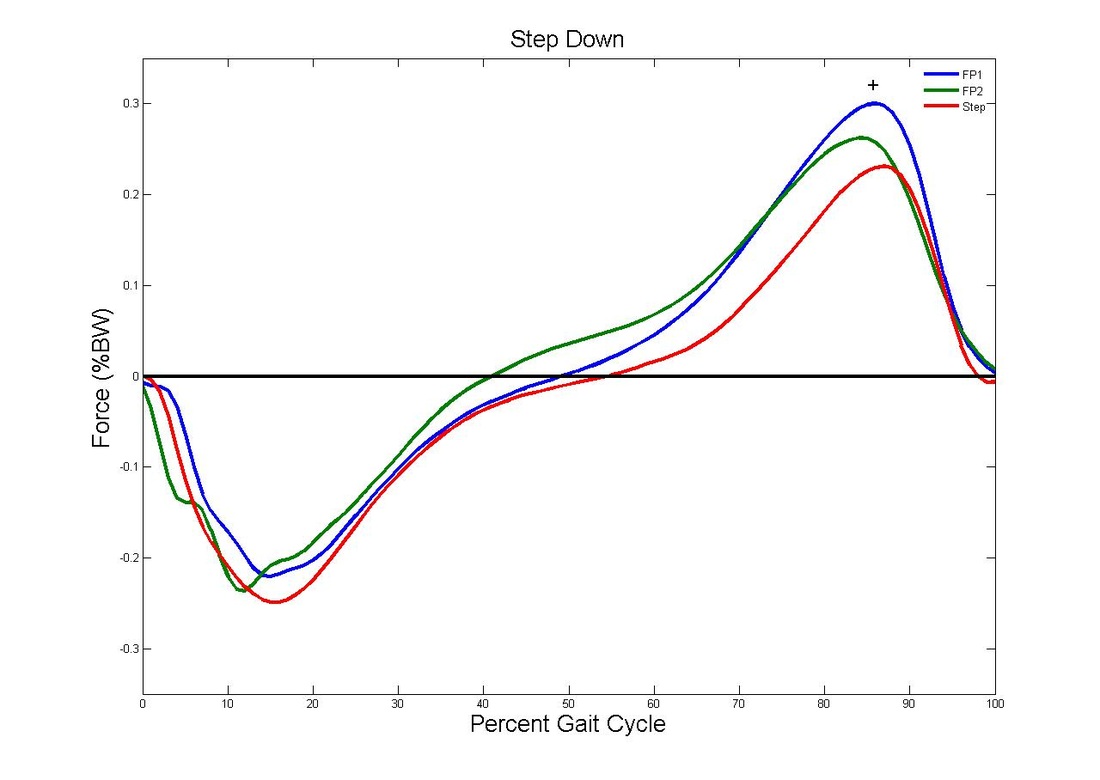
Figure 2
Figure 2 represents the vertical force (V) for the gait cycle while stepping down. . The initial peak (heel strike) on FP2 is much greater than Step or FP1. As FP2 comes to the second peak (toe strike) it is closer to normalized but still greater than Step. FP1 has a normal heel strike, but a raised toe strike.
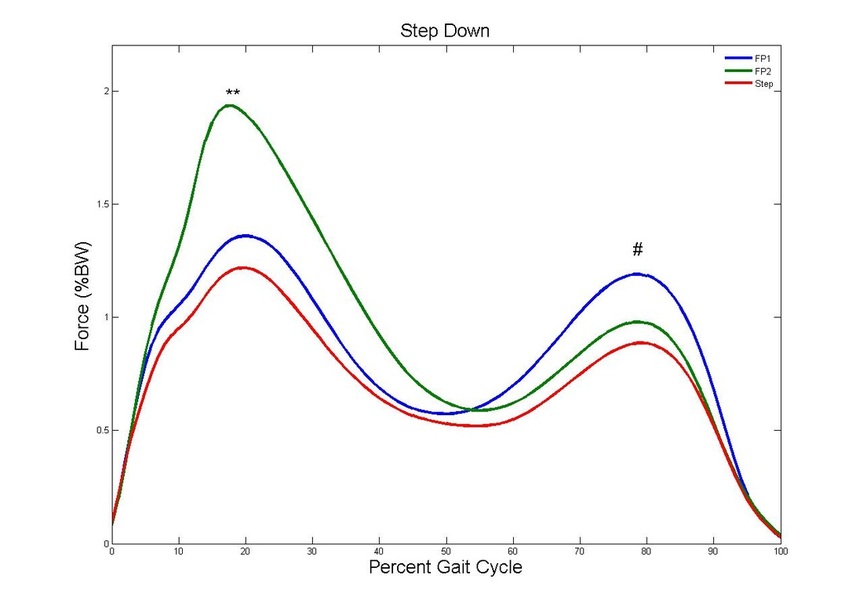
Figure 3
. Stance time on the second plate is lower than the first and third plates. The second plate is where the step down from the curb was taken.
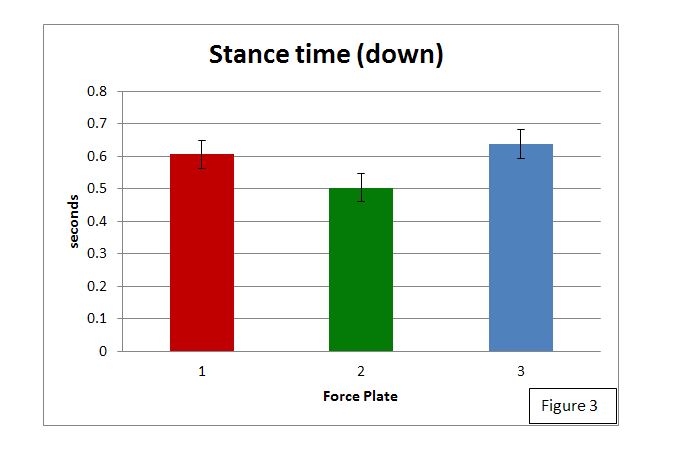
Figure 4
. Figure 4 shows the average peaks of the force graphs displayed in figures 1 and 2.
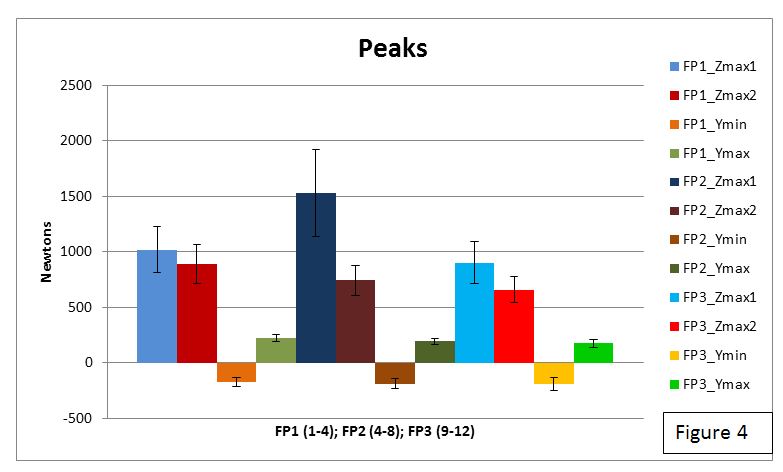
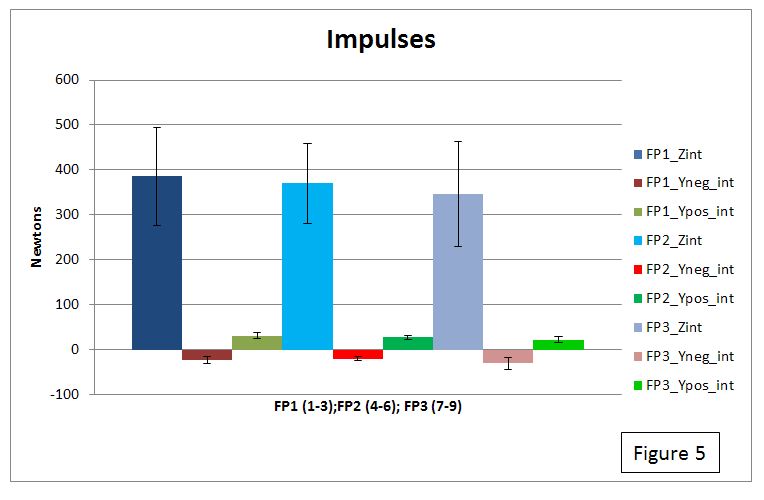
Figure 5
Impulses show the change in momentum for the force being applied.